|
brent harris elliott wave
futures market
advisory service
quarterly report sample page
wheat (jan. 31, 2009)
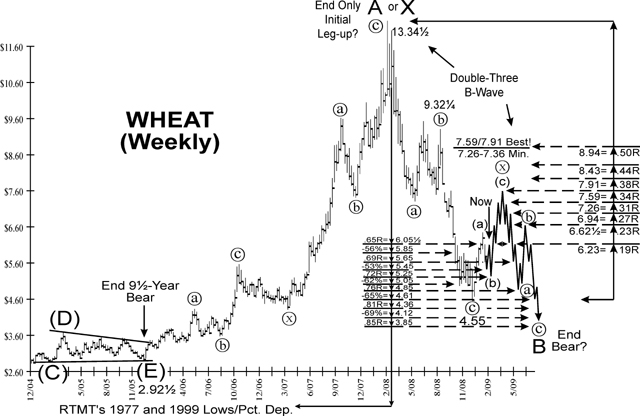
while it�s unlikely that
a long-term bottom could have been hit this quickly in the wheat, as the
february-to-december 2008 decline (13.34 �-to-4.55) only lasted for about
10-months, it does look like a pretty bullish pattern will remain in force until
at least the end of february, 2009. because the dec.-feb drop not only
traced-out a very large, [a]-[b]-[c] pattern, but this decline also produced a
rather "hefty" depreciation of about 66%, the current rally almost has to be of
at least the same-degree as the may-august 2008 advance. in which case, prices
should remain in a general uptrend for about 3-months...minimum. of course,
since it�s also possible that we are in a cycle-wave-b advance here, of the
same-degree as the entire feb-dec 2008 drop, we could certainly see a much
larger, and longer-lasting advance. however, because this scenario does not fit
well with either the corn, or soybeans, i�m inclined to focus on the more
conservative count. to that end, my best guess here is that the larger movement
off the dec 2008 top is unfolding into a classic, double-three formation. in
which case, once the current, primary wave-[x] rally off the december 2008 low
is traced-out, prices should then stage a final, [a]-[b]-[c] decline that will
likely last for a similar duration to that of the first [a]-[b]-[c] drop, or
about 10-months. so, while our longer term objective is to go short this market,
the near-term formation looks pretty bullish...at least for another month or
two. note, because the dec-jan rally appears to have finished only an initial,
(a)-wave section up, we should have a good buying opportunity on the current,
wave-(b) pullback. once a wave-(b) decline ends, my bare minimum, upside target
for the ensuing wave-(c)rally is at about the 7.26 3/4-7.36 1/4 area. and, it�s
also possible that prices could stretch as high as the 7.52 �-7.59 and/or
7.91-8.02 � maximum resistance areas. anyhow, while i do have good support for
the nearby march wheat at both the 5.71 �-5.66 and 5.52-5.43 levels, our best
buy-zone (for a wave-(b) low) is at 5.30-5.22 �.
order brent's quarterly report |